In brief
- Israel launched a military operation against Iran, spooking markets. Are Bitcoin investors panicking?
- Data shows Bitcoin still remains in bullish territory, unlike traditional markets.
- Ethereum and other altcoins, though, aren’t faring as well.
The Middle East is again at war, with rising tensions between Israel and Iran spooking markets and sending prices for both traditional and crypto assets, such as Bitcoin and Ethereum, tumbling to weekly lows. Is it time to panic for Bitcoin investors? The data currently doesn’t support that view.
Bitcoin dropped 4.5% in the past 24 hours to trade at $104,343, while Ethereum crashed 8.2% to $2,552 as escalating Middle East tensions sparked a massive risk-off move across cryptocurrency markets. The selloff, which began during Asia trading hours on June 13, wiped out over $420 billion from the total crypto market cap and triggered $1.2 billion in leveraged liquidations.
Following news that Israel had launched a major military operation against Iran, digital assets indeed tumbled sharply. The pre-dawn airstrikes targeting Iranian nuclear and military facilities sent shockwaves through global financial markets, with cryptocurrencies bearing the brunt of the selling pressure as investors fled to traditional safe havens.
The odds of such dramatic escalation seemed remote just days ago. The probability of Israel attacking Iran was trading at less than 20% throughout the week on the prediction market Polymarket, dipping as low as 11% at various points. And this is something markets don’t like—not war, but uncertainty. Currently, on Myriad Markets—a prediction market developed by Decrypt’s parent company Dastan—the odds of a US-Iran nuclear deal before the end of the week has dropped to just 4.7%.
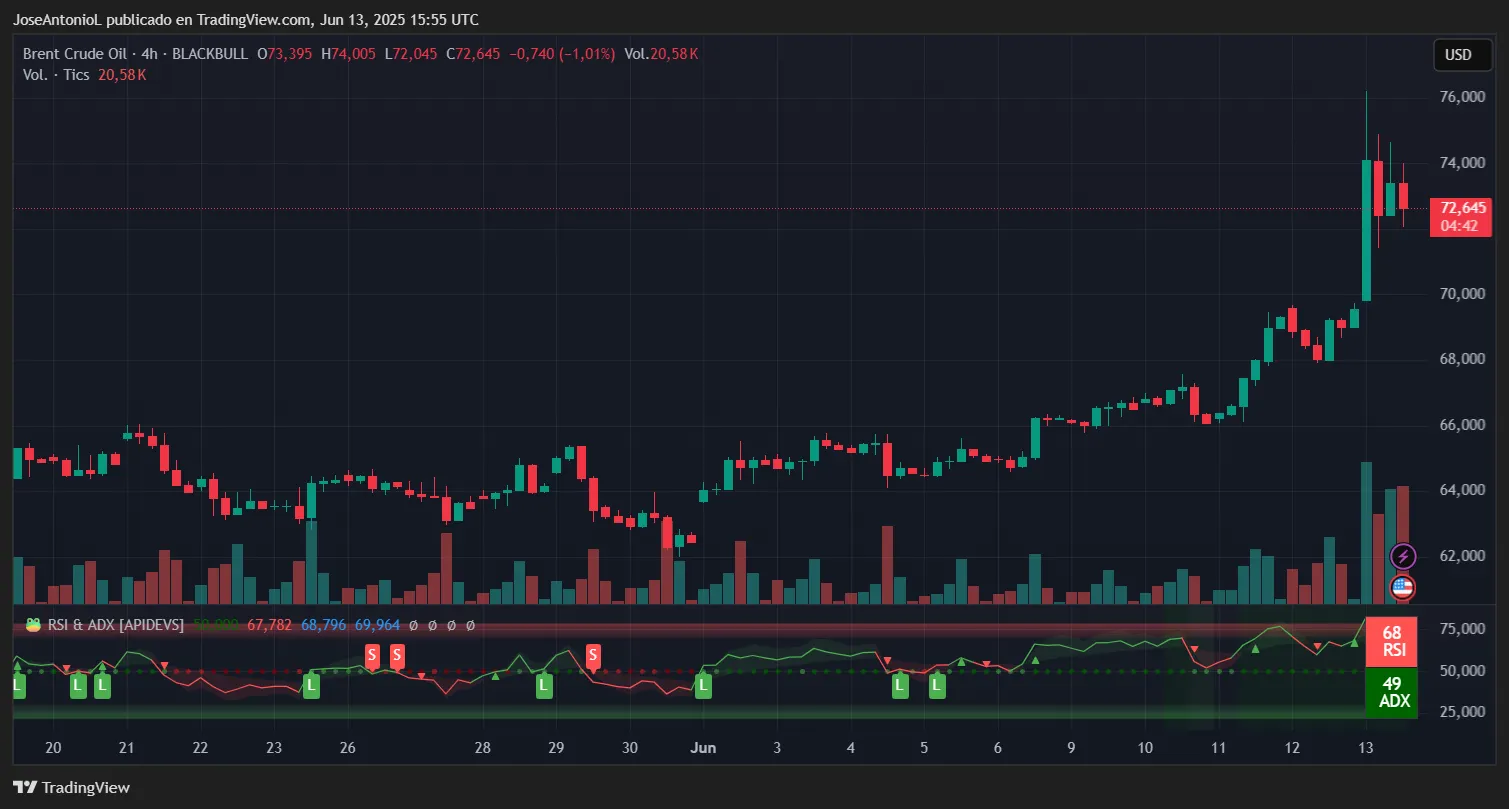
Meanwhile, the S&P 500 dropped 0.66% and the Dow Jones Industrial Average fell 1.17% as investors fled to traditional safe havens. Gold surged 1.8% to $3,445 per ounce, approaching its record high of $3,500.05, while Brent crude oil prices jumped as much as 9.21% during Asia hours before settling around 7% higher at $72.6 per barrel.

The sharp moves in commodities reflected genuine supply concerns. Iran, as OPEC’s third-largest producer, controls critical oil infrastructure, and any prolonged conflict could severely disrupt global energy markets. Defense stocks predictably surged. Just for context, Lockheed Martin and Palantir jumped about 3% as investors positioned for potential military escalation
The crypto Fear & Greed Index, which measures investors’ appetite for these risk assets, retreated from 65 to 54, moving from “greed” to “neutral”—an arguably healthy reset rather than the extreme fear readings typically associated with major market bottoms. This measured shift in sentiment, combined with continued ETF inflows of $86.31 million into Bitcoin despite the price decline, suggests institutional conviction remains intact.
Bitcoin shows measured response despite $1.2 billion in liquidations

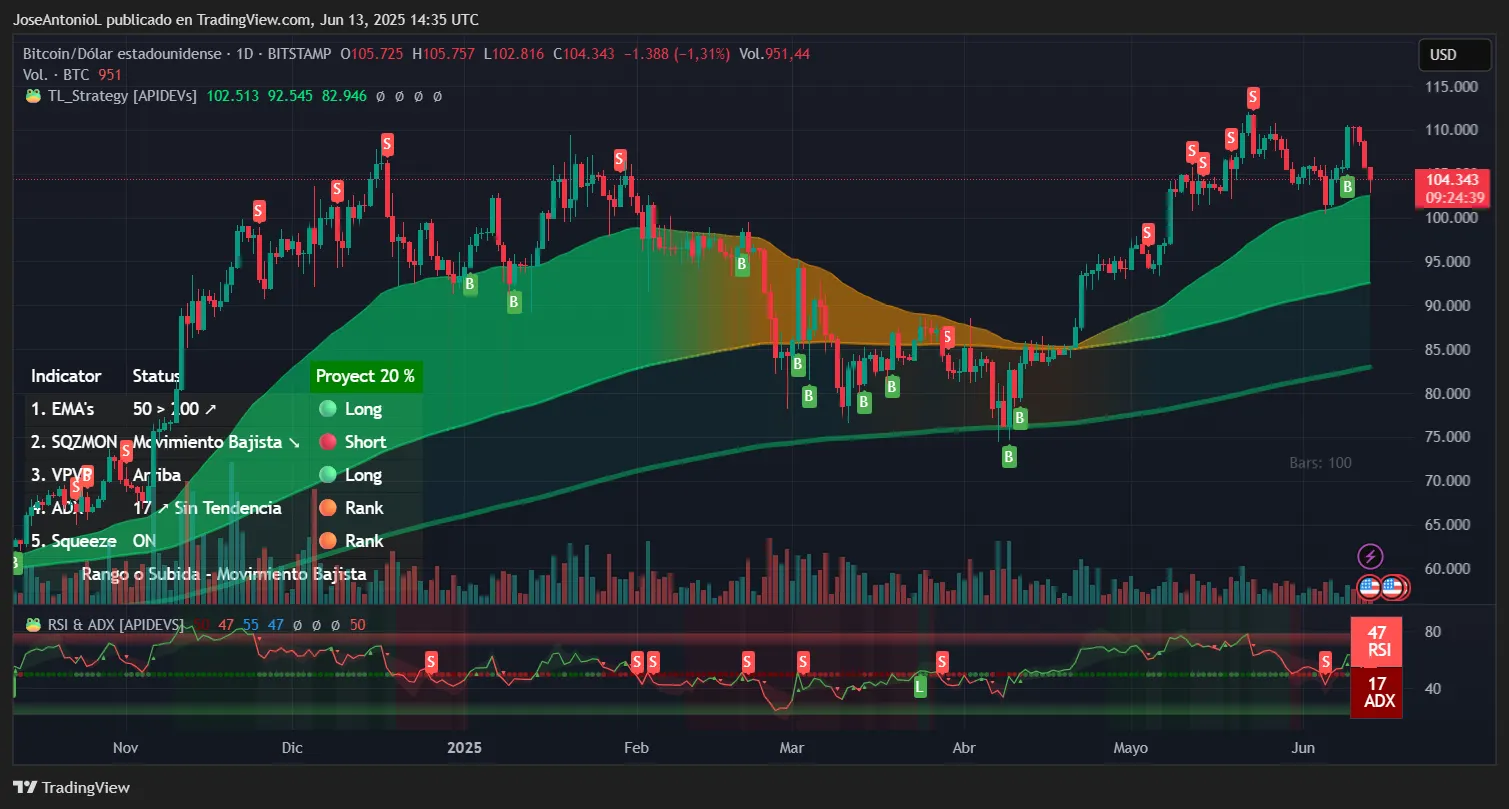
Against this backdrop of panic in traditional markets, Bitcoin’s 2.4% decline to $104,343 appears remarkably contained. Yes, the leading cryptocurrency triggered $1.2 billion in leveraged liquidations as it broke below the psychologically important $106,000 level. But considering the magnitude of the geopolitical shock, the selloff lacks the hallmarks of genuine panic.
The technical picture supports this thesis. Bitcoin’s Relative Strength Index, or RSI, on the daily chart sits at 47—down from overbought levels near 80 last week but still firmly in neutral territory. This suggests profit-taking rather than capitulation. The Average Directional Index (ADX), which measures the strength of a trend regardless of direction, is now at 17, which indicates weak directional momentum. That means the current move lacks the conviction typically seen during crisis-driven crashes, which tracks with the coin’s recent lateralization.
Bitcoin’s Exponential Moving Average, or EMA, is even more telling. EMA measures the average price of an asset, in this case Bitcoin, over a given period of time. Bitcoin’s 50-day EMA at $102,513 provided initial resistance on the bounce attempt, suggesting technical levels still matter—a sign that algorithmic trading rather than emotional panic is driving price action. The 200-day EMA sits much lower at $92,687, showing the longer-term uptrend remains intact.
For Bitcoin, the immediate test lies at reclaiming the $105,757 level (50/200-day EMA confluence). Failure to break back above this level would target: $100,000 as psychological support, and $95,000 as visible support, based on the charts.
Upside resistance stands at $110,000, with the recent all-time high near $111,891 remaining the key level for bulls to reconquer.
Ethereum and altcoins bear the brunt

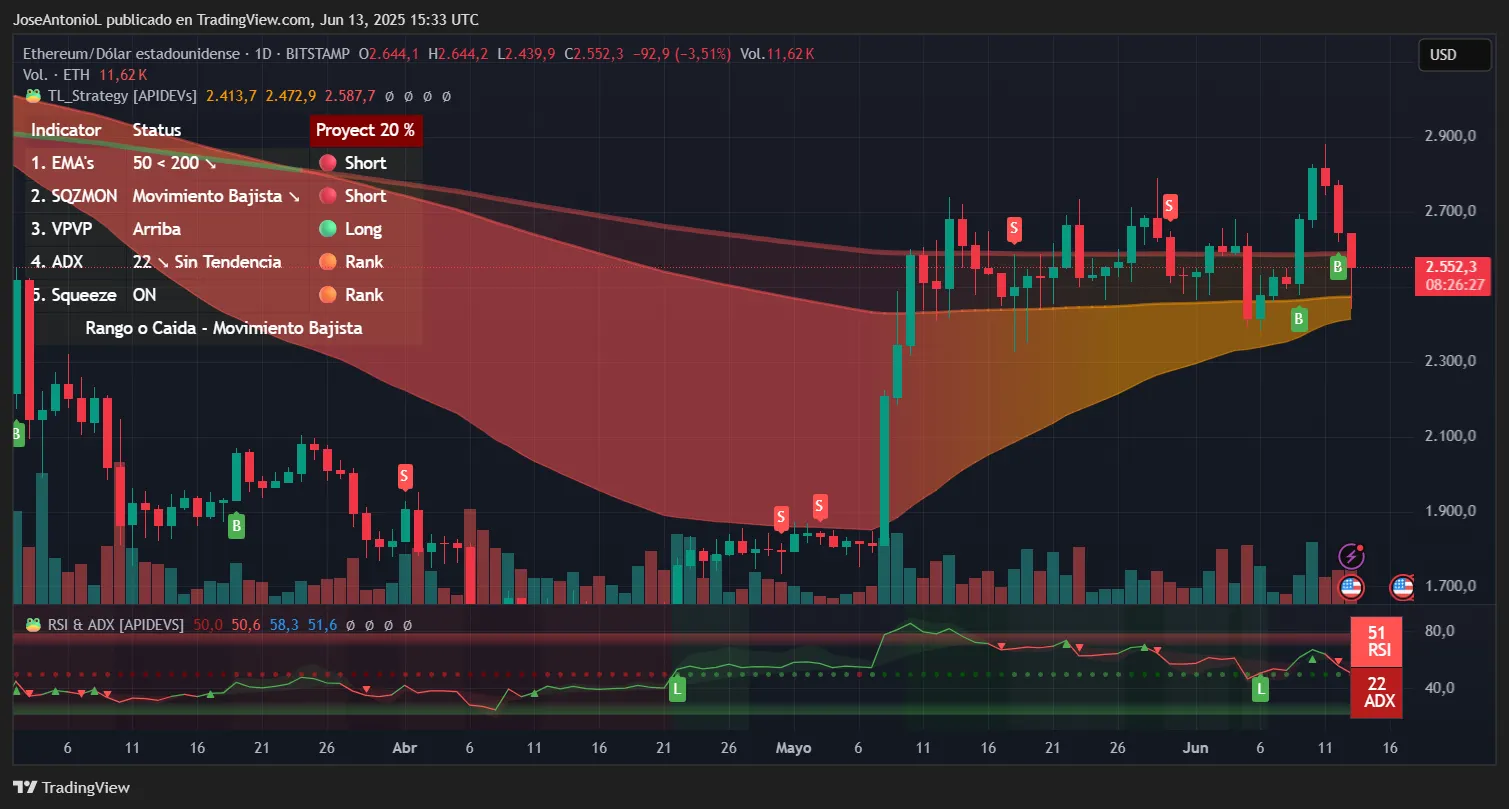
Ethereum’s steeper 7% drop to a daily low of $2,439 before bouncing to its current $2,552.30 reflects the typical risk-off rotation from altcoins to Bitcoin during market stress. Despite recording 19 consecutive days of ETF inflows, ETH couldn’t maintain support above $2,700 as traders de-risked portfolios.
The second-largest cryptocurrency’s technical indicators paint a more bearish picture than Bitcoin’s. With RSI at 50.6 and the ADX at 22 showing that the bullish bounce is now very, very weak, and the longer bearish trend is still in play, Ethereum shows stronger directional movement to the downside. The price is currently hovering near the 200-day EMA ($2,473), having broken below it during the selloff. The 50-day EMA sits at $2,417, and a break below would signal a more significant trend change.
Ethereum bulls, then, must defend the current $2,552 level to avoid a deeper correction. The key levels to watch are the resistances at $2,738 and an immediate support hear the psychological levels of $2,417.
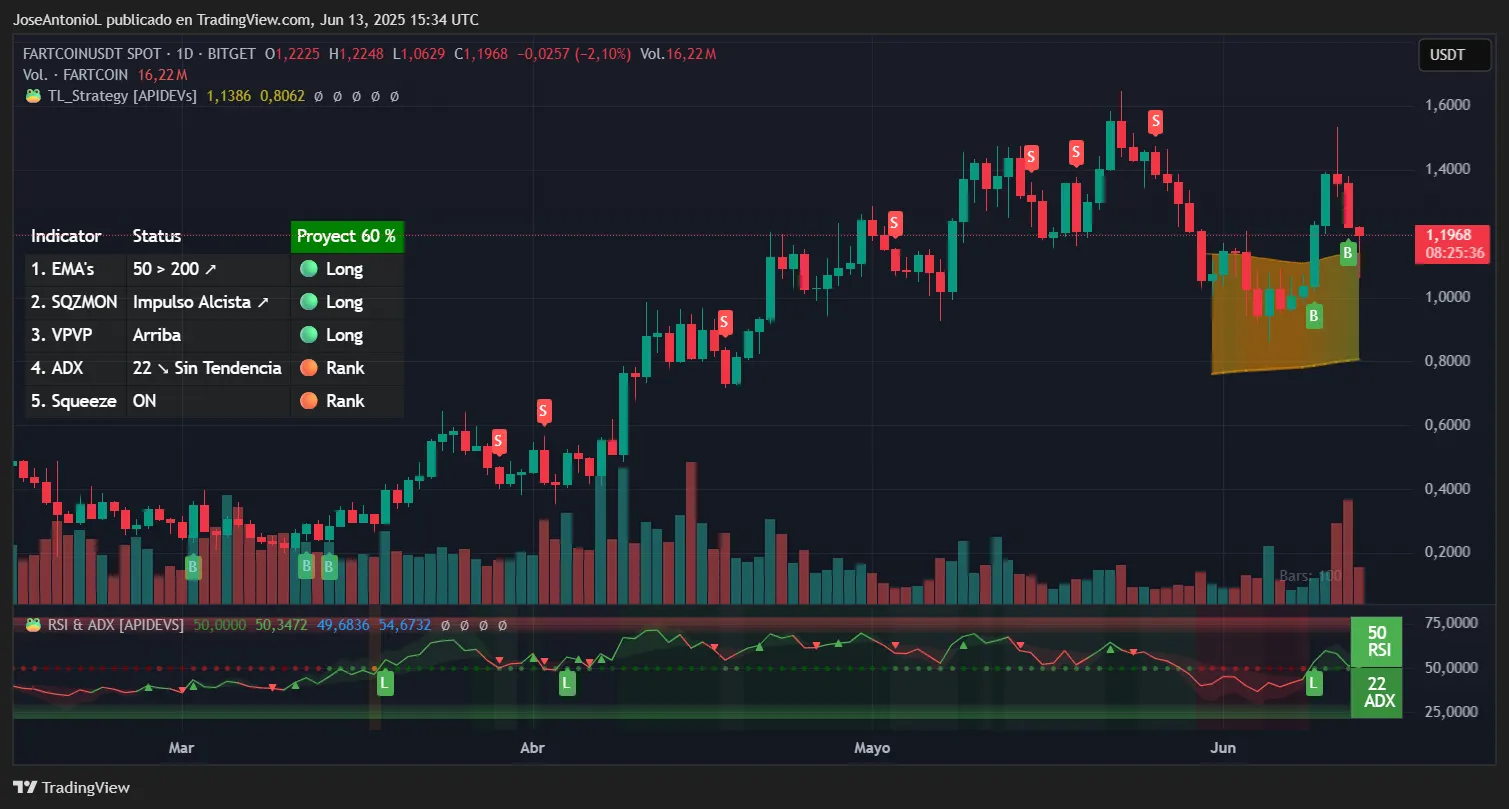
Meme coins suffered disproportionate losses, with Fartcoin—this week’s epitome of meme coin bullishness for absolutely no meaningful reason—plummeting 12% to $1.1968. The token’s breakdown from its ascending wedge pattern, combined with strong selling pressure, exemplifies how speculative positions unwind rapidly during times of uncertainty. The RSI at 50 shows neutral momentum after falling from overbought conditions, while the ADX at 22 confirms the switch from bullish to neutral move.

And even with all that said, the chart still paints an overall bullish picture for Fartcoin, and meme coins tend to do weird things. As a general rule, though, you can expect meme coins and other altcoins to mirror Bitcoin’s moves, but with a lot more volatility.
Disclaimer
The views and opinions expressed by the author are for informational purposes only and do not constitute financial, investment, or other advice.
Daily Debrief Newsletter
Start every day with the top news stories right now, plus original features, a podcast, videos and more.
https://decrypt.co/325114/nobody-predicted-israel-iran-strike-bitcoin-not-panic-mode


